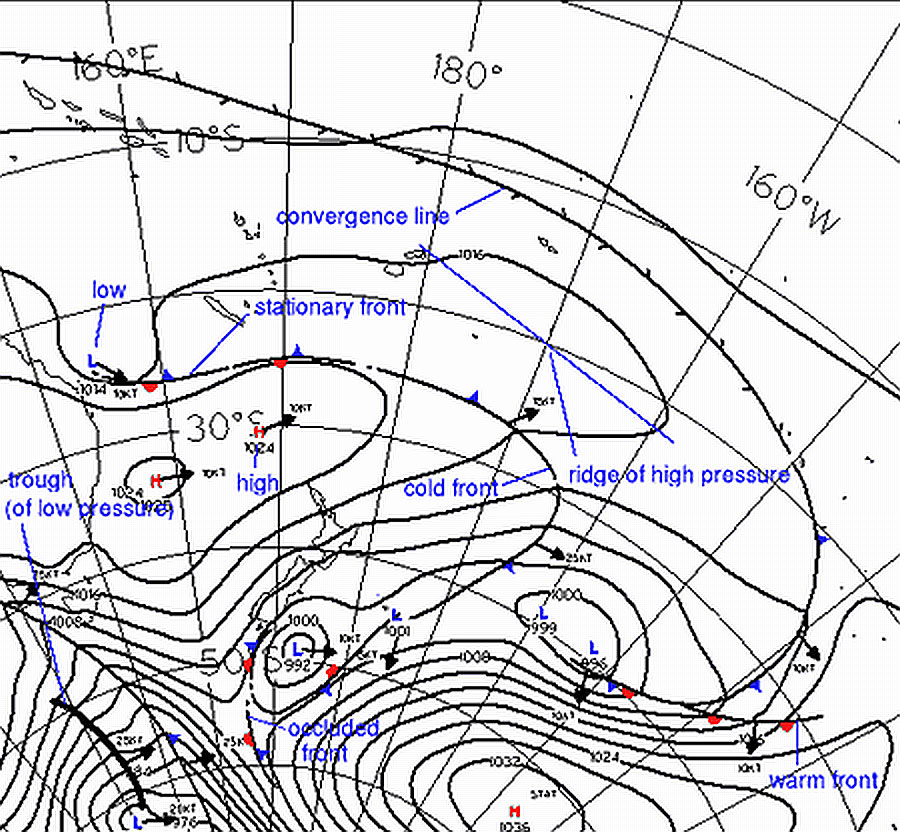
- Isobars – lines of equal pressure marked as lines around highs and lows. The closer the isobars, the stronger the winds
- Anticyclone (“high”) – Shown as an “H“
- depression (“low” or “cyclone”) – Shown as an “L“
- Ridge of high pressure – When isobars turn a sharp corner around a High they form what is called a ridge of high pressure, which is often shaped like a tongue extending from the High center.
- Trough of low pressure – Black lines showing unstable air
- Col – A Col is the neutral area between highs and lows. Shown as a large gap in isobars
- Cold fronts – marked by a line with triangles pointing to where it is moving
- Warm fronts – marked by a line with semicircles pointing to where it is moving
- Warm Sector – The area behind a warm front and ahead of a cold front
- Occluded fronts – marked by a line with triangles and semicircles on the same side
- Stationary fronts – marked by a line with alternate triangles and semicircles on opposite sides